Understanding Standard Deviation and Z-Scores
How do statisticians determine what is 'normal' and what is an 'outlier'? Learn how to calculate Z-scores and map data onto a normal distribution bell curve.
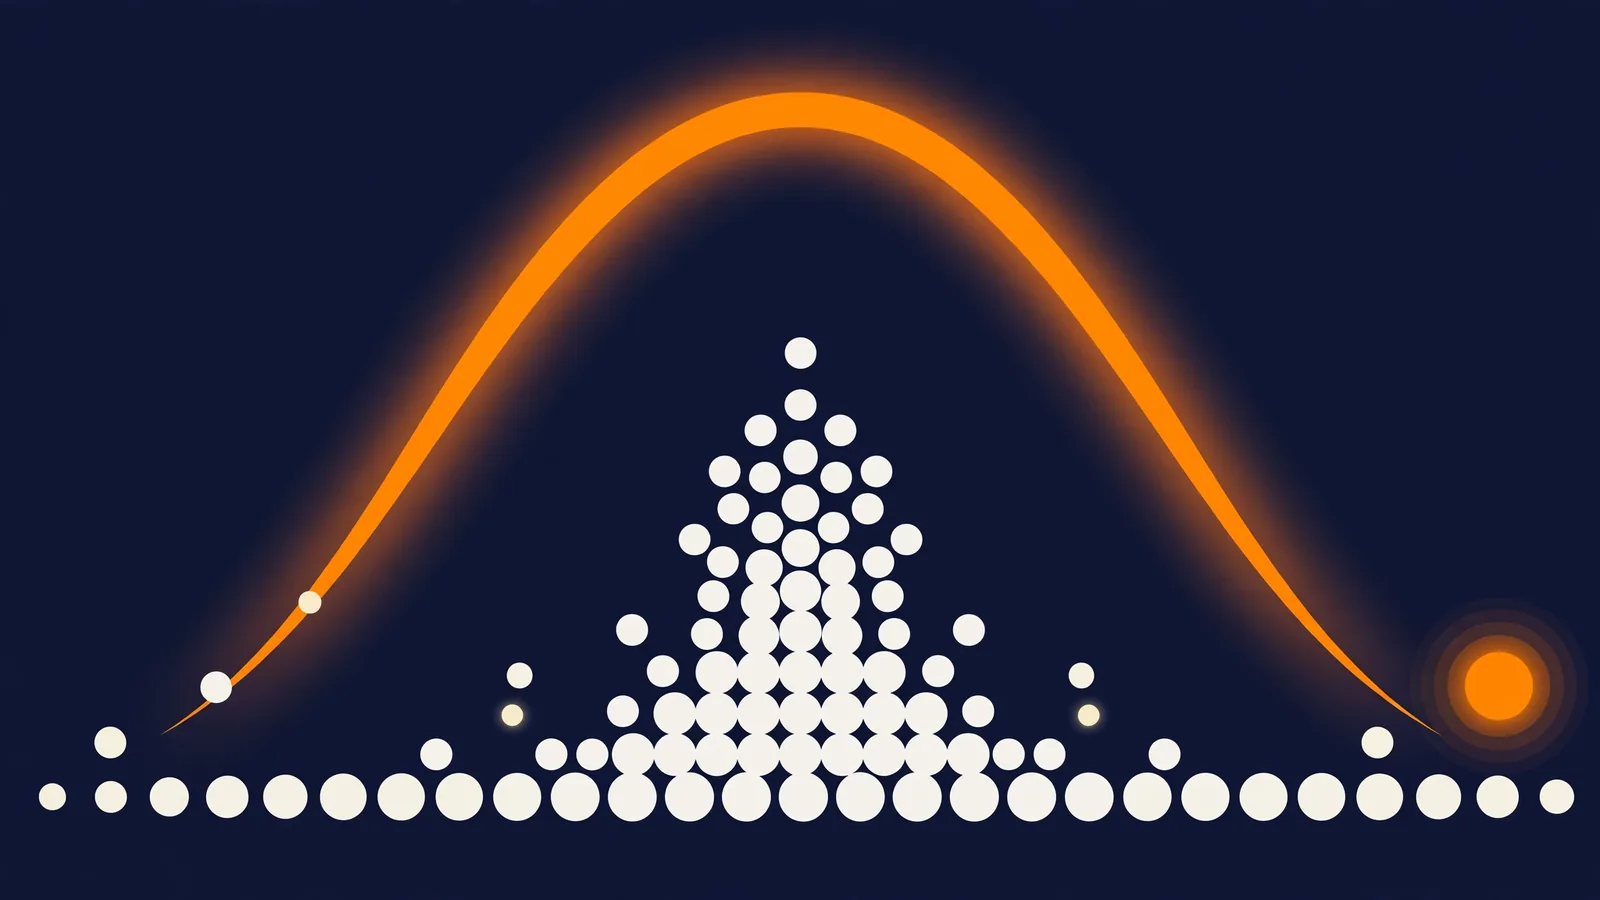
Calculate precise statistical deviations instantly using our Z-Score Calculator, or read on to understand the math behind the famous "bell curve."
If you score an 85 on a difficult math exam, is that a good score or a bad score?
Without context, an 85 means nothing. If the class average was a 95, you did poorly. If the class average was a 60, you did exceptionally well. In statistics, we don't just look at the raw number; we look at how far that number deviates from the average. This is measured using a Z-Score.
What is a Z-Score?
A Z-Score (also called a Standard Score) is a mathematical metric that tells you exactly how many Standard Deviations a specific data point is from the Mean (average) of the dataset.
- A Z-Score of 0 means the data point is exactly average.
- A positive Z-Score (e.g., +1.5) means the data point is above average.
- A negative Z-Score (e.g., -2.0) means the data point is below average.
Enter your own numbers and see the result instantly — free, no signup.
The Z-Score Formula
To calculate a Z-Score, you need three numbers:
- X: The specific data point you are measuring (e.g., your test score).
- μ (Mu): The Mean (average) of the entire population.
- σ (Sigma): The Standard Deviation of the population.
Z = (X - μ) / σ
Example Calculation
You score an 85 on a test. The class average (Mean) was 70. The Standard Deviation was 10.
- Subtract the Mean from your score:
85 - 70 = 15 - Divide by the Standard Deviation:
15 / 10 = 1.5
Your Z-Score is 1.5. You scored 1.5 standard deviations above the class average.
Where the Standard Deviation Comes From
The formula needs σ, but where does that number itself come from? Standard deviation measures how spread out the data is around its mean.
Here is the full calculation for a tiny dataset: 4, 6, 8, 10, 12.
- Find the mean:
(4 + 6 + 8 + 10 + 12) ÷ 5 = 8 - Find each deviation: −4, −2, 0, 2, 4
- Square each deviation: 16, 4, 0, 4, 16 — squaring removes the negative signs
- Average the squares:
(16 + 4 + 0 + 4 + 16) ÷ 5 = 40 ÷ 5 = 8. This is the variance - Take the square root:
√8 ≈ 2.83
The standard deviation is about 2.83. A value like 12 sits (12 − 8) ÷ 2.83 ≈ 1.41 standard deviations above the mean.
For datasets of any real size, our Standard Deviation Calculator runs all five steps instantly.
Population vs. Sample: The n − 1 Wrinkle
If your data is a sample rather than the full population, step 4 divides by n − 1 instead of n. This slightly increases the result, correcting for the fact that a sample understates the true spread.
For the dataset above, the sample variance is 40 ÷ 4 = 10, giving a sample standard deviation of about 3.16. Same data, slightly different denominator — know which one your situation calls for.
The Empirical Rule (68-95-99.7)
Z-Scores are incredibly powerful because almost all naturally occurring data (like human height, test scores, or blood pressure) follows a "Normal Distribution," which looks like a symmetrical Bell Curve.
Statisticians use the Empirical Rule to quickly analyze data on a bell curve:
- 68% of all data falls between a Z-Score of -1.0 and +1.0. (This is considered "Normal").
- 95% of all data falls between a Z-Score of -2.0 and +2.0.
- 99.7% of all data falls between a Z-Score of -3.0 and +3.0.
Using our test score example above (Z-Score of 1.5), we know that you scored higher than roughly 93% of the entire class.
From Z-Score to Percentile
The Empirical Rule gives ranges. A percentile is more precise: it states the percentage of the population scoring below a given value.
For a normal distribution, each Z-Score maps to a fixed percentile:
| Z-Score | Percentile |
|---|---|
| −2.0 | 2.28th |
| −1.0 | 15.87th |
| 0 | 50th |
| +1.0 | 84.13th |
| +1.5 | 93.32nd |
| +2.0 | 97.72nd |
| +2.5 | 99.38th |
Read the +1.5 row carefully: it confirms the exam example. A Z-Score of 1.5 means outperforming about 93.32% of the group.
Our Percentile Calculator converts in the other direction as well, from a rank back to the value that produced it.
Comparing Scores From Different Tests
Here is the superpower the FAQ below hints at. Two students take completely different exams, with different scales and different averages. Who performed better relative to their group?
- Student A: scored 1,200 on a test with a mean of 1,000 and a standard deviation of 200. Z =
(1,200 − 1,000) ÷ 200 = 1.0 - Student B: scored 27 on a test with a mean of 21 and a standard deviation of 5. Z =
(27 − 21) ÷ 5 = 1.2
Student B performed better relative to their peers, despite the raw numbers being incomparable. These are illustrative figures, but the method is exactly how different scoring systems are reconciled.
A Height Example You Can Feel
Abstract exam numbers are easy to forget, so translate the idea to something physical. Use these round, illustrative figures for adult height: a mean of 69 inches and a standard deviation of 3 inches.
A man who is 6 feet 3 inches tall measures 75 inches. His Z-Score is (75 − 69) ÷ 3 = 2.0, placing him near the 97.7th percentile — taller than almost everyone in the room.
A man of 63 inches gets (63 − 69) ÷ 3 = −2.0, the mirror image at the 2.28th percentile. Equal distance from average, opposite direction — the sign carries that information.
Running the Formula in Reverse
Sometimes you know the percentile you want and need the raw score that achieves it. Rearranging the formula gives X = μ + Zσ.
Suppose a scholarship requires roughly the 90th percentile, which corresponds to a Z-Score of about 1.28. On a test with a mean of 70 and a standard deviation of 10:
X = 70 + (1.28 × 10) = 82.8
A score of about 83 is the target. Working backward from a cutoff is how admissions and licensing thresholds are translated into study goals.
Identifying Outliers
In research and data science, Z-Scores are used to identify statistical outliers—data points that are so far from the norm that they might indicate an error or a highly unique event.
A general rule of thumb in statistics is that any data point with a Z-Score greater than +3.0 or less than -3.0 is considered an outlier. Less than 0.3% of naturally occurring data should ever land that far from the average.
An outlier is a flag, not a verdict. It might be a genuine record-breaking result, a typo in data entry, or the first sign that the data does not follow a bell curve at all.
When Z-Scores Mislead
The percentile table and the Empirical Rule carry a hidden assumption: the data must be roughly bell-shaped. Many real datasets are not.
Household income is the classic counterexample. It bunches up at the low end with a long tail of high earners, so the mean sits far from the middle person.
Computing a Z-Score for such data is still possible — the formula always produces a number. But claiming "95% falls within two standard deviations" would simply be false.
Before interpreting any Z-Score, ask whether the underlying distribution plausibly resembles a bell. If it does not, percentiles based on ranking the actual data are the safer tool.
FAQ
Why do we use Z-Scores instead of just looking at the difference from the average? Z-Scores standardize data across completely different units of measurement.
Because a Z-Score converts raw data into "Standard Deviations," you can use it to mathematically compare apples to oranges (e.g., comparing your SAT score to your friend's ACT score to see who is actually smarter relative to their testing group).
What is a "good" Z-Score? There is no universal answer. For a test you want to ace, higher is better. For blood pressure or defect rates, the goal is usually to sit near the average or below it. A Z-Score only measures position, not desirability.
Can a Z-Score be larger than 3 or smaller than −3? Yes. Values beyond ±3 are rare in bell-shaped data — about 3 in 1,000 fall outside — but they occur, especially in large datasets. A dataset of a million points will contain thousands of them legitimately.
Is the mean the same as the 50th percentile? On a perfectly symmetrical bell curve, yes: half the data falls below the mean. On skewed data, the mean and the median (the true 50th percentile) can sit far apart, which is another reason to check the shape first.
Don't struggle with complex standard deviation formulas by hand. Map your data to the bell curve instantly using the CalcUnit Z-Score Calculator.